
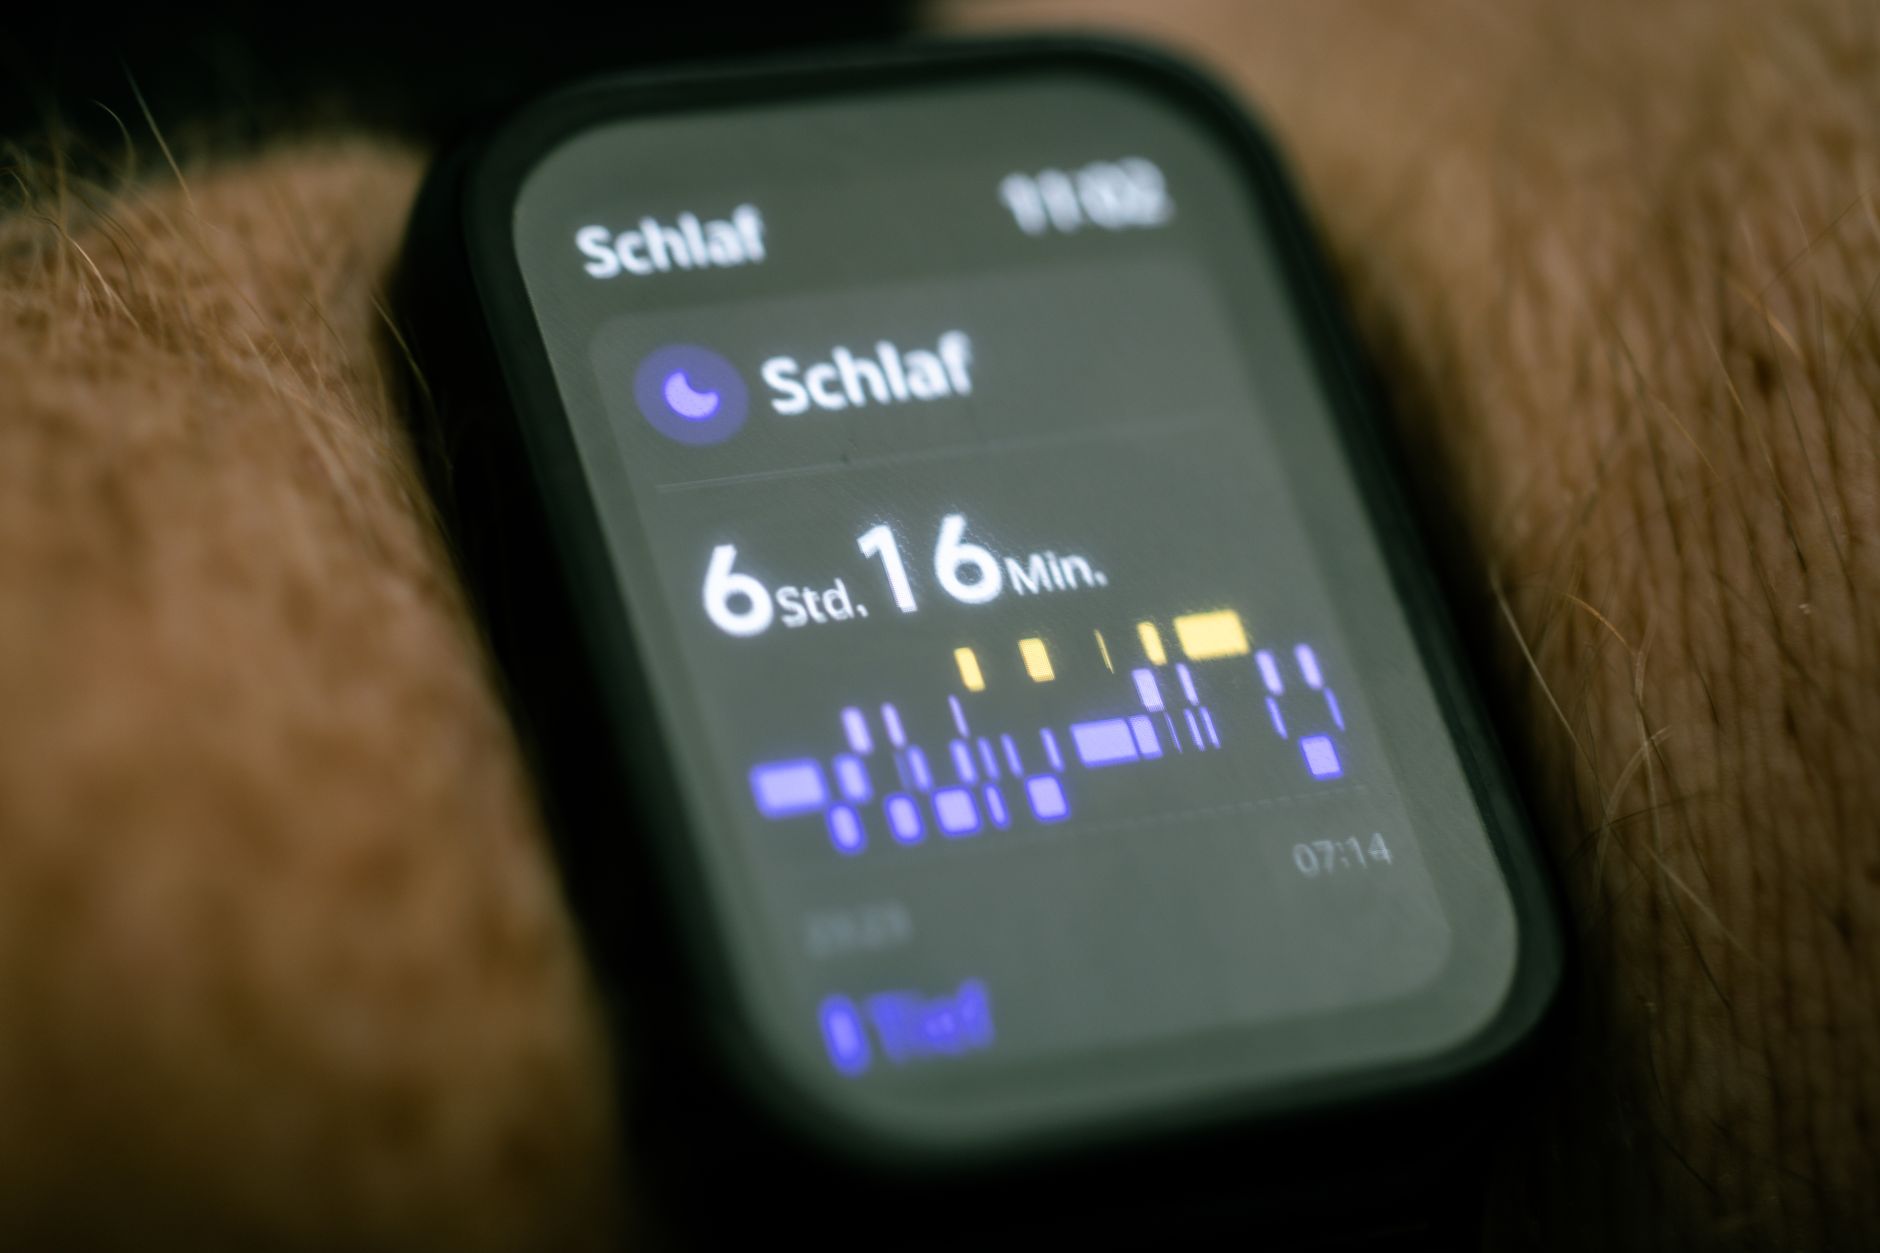
Millions of people now wake up to a glowing summary of their night. A smartwatch or smart ring might report that you slept 6 hours and 42 minutes, spent 18 percent of the night in deep sleep, and earned a score of 74. Those numbers can feel authoritative, but they are estimates. Learning what they mean, and what they don’t, is the key to using sleep tracker data well and turning it into real improvement in how you rest.
This guide explains how modern sleep technology works, which metrics matter most, where the limits lie, and how to build habits from your track sleep quality results without becoming anxious about every number.
Why Sleep Data Deserves Attention
Sleep is not a passive break from daily life. During the night, the body repairs tissue, consolidates memory, regulates hormones linked to appetite and stress, and supports immune function. Public health guidance from major sleep organizations generally recommends that adults get at least seven hours of sleep per night on a regular basis. Chronic shortfalls are associated with poorer concentration, mood changes, and higher long-term risks for several health conditions.
The appeal of a tracker is that it makes an invisible behavior visible. Patterns that were once guesswork, such as going to bed late on weekends or sleeping poorly after an evening workout, can appear clearly across weeks of data. The value lies in spotting those trends, not in obsessing over one night.
How Sleep Trackers Estimate Your Sleep
Most consumer devices, whether wrist-worn or ring-shaped, rely on two main signals. The first is movement, detected by an accelerometer. Lying still for long periods suggests sleep, while frequent movement suggests wakefulness. This approach is called actigraphy, and researchers have used it for decades.
The second signal is physiological data, usually heart rate and, on some models, heart rate variability (HRV), skin temperature, breathing rate, and blood oxygen. During different sleep stages, the heart rate typically slows and becomes more regular in deep sleep, while it can become more variable during REM sleep. Algorithms combine these signals to estimate when you fell asleep, when you woke, and which stage you were probably in.
Understanding this process explains much of what you see on your screen. The device is making a well-informed inference from indirect data, not directly measuring brain activity the way a clinical lab does.
The Metrics That Matter Most
Sleep dashboards can display a dozen or more numbers. Focusing on a handful makes them far easier to interpret.
Total Sleep Time
This is the amount of time you were asleep, excluding periods of wakefulness. It is the most reliable headline figure and the one most closely tied to how rested you feel. If your tracker consistently shows fewer than seven hours on workdays, that is a useful signal worth acting on, even if the exact figure is slightly off.
Sleep Efficiency
Sleep efficiency compares time asleep with total time spent in bed. If you were in bed for eight hours and slept for seven, your efficiency is about 87.5 percent. Many sleep professionals consider efficiency above roughly 85 percent to be healthy for adults, though this varies by individual and context. Low efficiency often points to long periods of lying awake, which can be a sign of stress, irregular schedules, or an environment that is too bright, warm, or noisy.
Sleep Latency
Sleep latency is how long it takes you to fall asleep after getting into bed. Most healthy adults fall asleep within about 10 to 20 minutes. Consistently very short latency may suggest significant sleep debt, while consistently long latency can indicate racing thoughts, caffeine timing issues, or other concerns.
Sleep Stages
Trackers usually break the night into light sleep, deep sleep, and REM sleep, along with time awake. Deep sleep is associated with physical restoration, and REM sleep is linked to dreaming and emotional processing. Both are important, and most people cycle through these stages several times a night.
Here is the crucial caveat: consumer devices are far better at distinguishing sleep from wake than at identifying specific stages. Research comparing wearables with polysomnography, the clinical gold standard, has generally found good agreement for total sleep and wake detection, but more variable accuracy for stage classification. Treat exact minutes of deep sleep as approximate. A stable pattern over time is more meaningful than any single night’s percentage.
Resting Heart Rate and HRV
Resting heart rate during sleep is often one of the more stable physiological indicators. Heart rate variability reflects how much the time between heartbeats fluctuates, and it is influenced by stress, recovery, alcohol, illness, and training load. A sustained drop in HRV or a rise in overnight resting heart rate can signal that your body is under strain, especially if it coincides with poor sleep. Again, single readings matter less than multi-day trends.
Where Trackers Fall Short
Being an informed user means knowing the limitations of your device.
Stage accuracy is imperfect. As noted above, the exact split between light, deep, and REM sleep should be taken as an estimate.
Sleep scores are proprietary. Each brand combines metrics using its own formula, weighting duration, stages, heart rate, and sometimes factors like bedtime consistency. A score of 80 on one app is not directly comparable to a score of 80 on another.
Stillness can be mistaken for sleep. If you lie motionless while awake, reading or meditating in bed, some devices may count that time as sleep. Conversely, a partner’s movement or restless legs may be misread as wakefulness.
Data can cause anxiety. Researchers and clinicians have described a phenomenon sometimes called orthosomnia, where people become so preoccupied with achieving perfect sleep metrics that they sleep worse. If checking your score first thing in the morning makes you feel stressed, it may be time to look less often.
Devices are not diagnostic tools. A tracker cannot diagnose sleep disorders such as obstructive sleep apnea or insomnia. If you snore loudly, wake up gasping, feel very sleepy during the day despite adequate time in bed, or have persistent insomnia, speak with a healthcare professional.
How to Read Your Data Over Time
The most useful way to interpret sleep data is through patterns rather than individual nights. Here is a practical approach.
Start by reviewing your weekly averages instead of daily results. Look at total sleep, bedtime, and wake time across seven to fourteen days. Irregular bedtimes, even when total sleep looks adequate, can affect the body’s internal clock and how refreshed you feel.
Next, compare good nights with poor ones. If your data consistently shows lower efficiency or longer latency after evening alcohol, late meals, intense exercise close to bedtime, or screen use, you have found a personal pattern worth addressing. Many people are surprised by how strongly one habit influences their numbers.
Finally, pair the data with how you actually feel. Track a simple subjective rating each morning, such as energy level from one to five. If your tracker says you slept poorly but you feel fine, the device may be underestimating your sleep. If it says you slept well but you wake exhausted, consider whether sleep quality, sleep apnea, stress, or other factors are at play. The numbers and your experience should inform each other.
Turning Insights Into Better Sleep
Data is only useful if it leads to action. Several evidence-based habits are commonly recommended, and your tracker can help you test them.
Keep a consistent wake time, including on weekends. This is often the single most effective change for regulating the body clock. Get daylight exposure in the morning to help anchor your rhythm. Limit caffeine in the afternoon and evening, since its effects can last for many hours. Keep the bedroom cool, dark, and quiet. Reduce alcohol close to bedtime, because although it may help you fall asleep, it tends to fragment sleep later in the night.
Use your tracker as a simple experiment. Choose one change, such as moving your last coffee earlier, and observe your efficiency and latency for two weeks. If the numbers improve and you feel better, keep the habit. If nothing changes, try a different adjustment. This approach turns sleep tracker data into a feedback loop rather than a source of judgment.
Choosing and Using Your Device Wisely
If you are considering a new device, look for transparency about how it calculates metrics and whether it has been validated against clinical measures. Consider comfort, since a device you don’t wear consistently produces incomplete data. Battery life matters too, because charging gaps create blind spots.
Whatever you choose, set realistic expectations. Use the device as a guide, cross-check results with how you feel, and seek professional advice for persistent problems. Good sleep depends on daily habits, a healthy environment, and sometimes medical care, and no wearable can replace those fundamentals.
Reading sleep data accurately means knowing what the metrics measure, respecting their limits, and focusing on long-term trends. Total sleep time, sleep efficiency, and consistency deserve the most attention. Sleep stages and proprietary scores are useful but approximate. Heart rate and HRV can reveal recovery patterns when viewed over days rather than hours.
Used thoughtfully, modern sleep technology can help you identify habits that support rest and notice when something needs attention. Used anxiously, it can become one more source of stress. The goal is not a perfect score every morning but a steadily better night’s sleep, and the data is most valuable when it helps you get there.